


Innovation – Collaboration
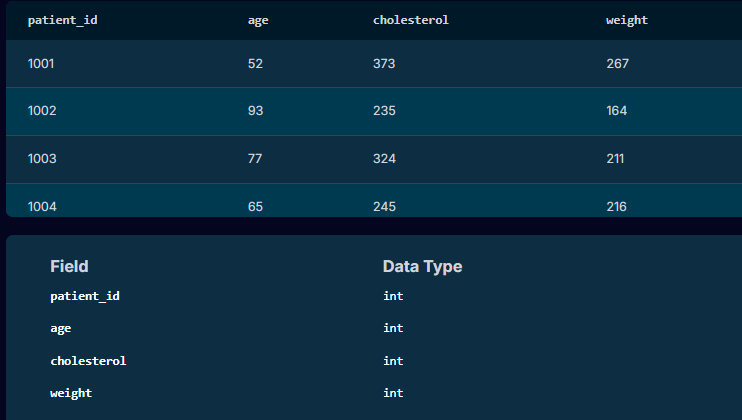
During a clinical trial the Principal Investigator notified the team that she has seen an uptick in heart attacks for his patients over the past few months. She has been noticing some trends across his patients and wanted to get ahead of things by reaching out to current patients who are at a high risk of a heart attack.
So, we needed to identify which patient she needs to reach out to and provide that information to her.
In summary, the SQL query written for the Doctor:
Innovation – Collaboration
In business analytics, Waterfall and Agile are two distinct methodologies used for managing projects. Each has its own strengths and is suited to different types of business environments and project needs.
Add a “Spend Tracker” feature to a bank’s mobile app that categorizes customer transactions and offers spending insights.
The client which was a traditional bank with strict regulatory and security controls opted for the Waterfall methodology.
Requirement Gathering (BA Role)
Conduct detailed stakeholder interviews and workshops.
Documents everything in a Business Requirements Document (BRD) and Functional Requirements Document (FRD).
These are reviewed, revised, and signed off.
Design
The technical part of the team designs the system based entirely on the signed-off documents.
Development
Work with the developers code the full feature as per specs. No major changes are accepted mid-project.
Testing
Team up with the QA to test the complete system against original specs using test cases written from the FRD.
Deployment
The final product is released only after all phases are complete.
Clear roadmap
Thorough documentation
Easy to measure progress
Slow to deliver value
Inflexible to changes
Risk of misaligned outcomes if initial assumptions were off
A fintech start-up wants to implement the Spend Tracker in their mobile app. They use Agile for speed and flexibility.
Sprint Planning (BA Role)
Worked with the Product Owner and team to break the features into small user stories (e.g., “As a user, I want to see my spending by category”).
Incremental Delivery
Myself and the Developers build and release small parts of the feature every 2 weeks (sprint).
I would then refine and update requirements as feedback comes in.
Daily Stand-ups & Backlog Grooming
Continuous collaboration with the team to clarify or adjust requirements.
Iterative Testing
BA & QA tests in each sprint.
Changes and improvements happen continuously.
Frequent Releases
Users start seeing value after the first few sprints rather than waiting months.
Fast feedback loops
Highly adaptable
Early value delivery
Less formal documentation
Requires high team involvement
Scope creep can be a risk if not managed well
Aspect | Waterfall | Agile |
Project Structure | Sequential (phases: plan → build → test) | Iterative (sprints/cycles) |
BA Involvement | Front-loaded | Continuous |
Documentation | Extensive (BRD, FRD, RTM, etc.) | Lightweight (User Stories, AC) |
Change Handling | Difficult once dev starts | Expected and welcomed |
Delivery Timeline | One big release at end | Frequent small releases |
Stakeholder Engagement | At milestones | Ongoing and active |
Best For | Fixed-scope, compliance-heavy projects | Innovative, evolving, user-focused work |
Use Waterfall for: Government systems, infrastructure projects, banking/insurance/pharmaceutical/oil and gas compliance.
Use Agile for: Customer-facing apps, SaaS tools, products with fast-changing requirements.
Innovation – Collaboration
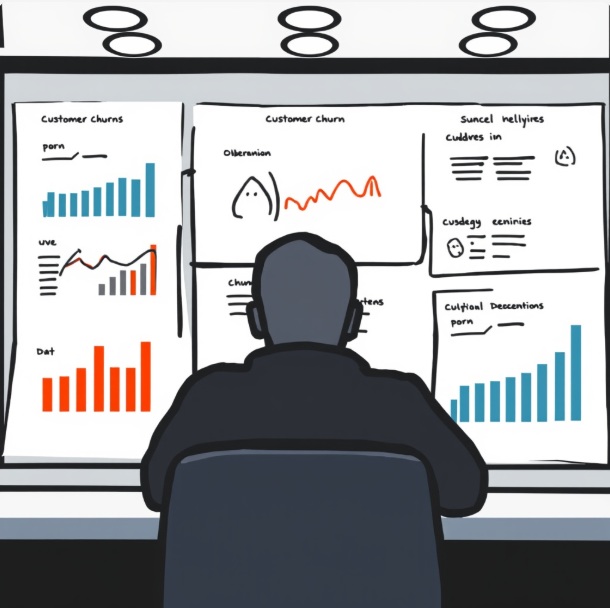
Below are BA-style SQL queries I’ve used on projects. I’ll explain why I ran each query, what question I was answering, and how it influenced the project.
“Who is churning, and when does it happen?”
SELECT
c.contract_type,
COUNT(*) AS total_customers,
SUM(CASE WHEN c.churn_flag = 'Y' THEN 1 ELSE 0 END) AS churned_customers,
ROUND(
SUM(CASE WHEN c.churn_flag = 'Y' THEN 1 ELSE 0 END) * 100.0 / COUNT(*),
2
) AS churn_rate_pct
FROM customers c
GROUP BY c.contract_type
ORDER BY churn_rate_pct DESC;
FROM customers cFROM customers c
This tells SQL we’re querying the customers table.
c is an alias — it makes the query shorter and easier to read.
🧠 BA thinking:
“This table should have one row per customer with contract and churn info.”
SELECT c.contract_type,
This groups customers by contract type
(e.g. Monthly, 12-Month, 24-Month)
🧠 BA insight:
“I want to compare churn across different contract models.”
COUNT(*) AS total_customersCOUNT(*) AS total_customers,
Counts how many customers are in each contract type.
COUNT(*) counts all rows in that group.
📊 Example output:
| contract_type | total_customers |
|---|---|
| Monthly | 8,000 |
| 12-Month | 5,000 |
🧠 Why I need this:
I can’t talk about churn percentages without knowing the base size.
SUM(CASE WHEN c.churn_flag = ‘Y’ THEN 1 ELSE 0 END)
SUM(CASE WHEN c.churn_flag = ‘Y’ THEN 1 ELSE 0 END) AS churned_customers,
CASE checks each customer:
If churn_flag = 'Y' → count as 1
Otherwise → count as 0
SUM() adds them up per contract type.
📊 Example:
| contract_type | churned_customers |
|---|---|
| Monthly | 2,400 |
| 12-Month | 400 |
🧠 BA translation:
“How many customers actually left under each contract?”
ROUND( churned / total * 100, 2 )
ROUND(
SUM(CASE WHEN c.churn_flag = ‘Y’ THEN 1 ELSE 0 END) * 100.0 / COUNT(*),
2
) AS churn_rate_pct
SUM(CASE WHEN churn_flag = ‘Y’ THEN 1 ELSE 0 END)
→ number of churned customers
2. Denominator:
COUNT(*)
→ total customers
3. Multiply by 100.0
Forces decimal calculation (important!)
Avoids integer division (e.g. 1/10 = 0)
4. ROUND(..., 2)
Rounds to 2 decimal places
Makes it presentation-ready for stakeholders
| contract_type | churn_rate_pct |
|---|---|
| Monthly | 30.00 |
| 12-Month | 8.00 |
🧠 Why this matters:
Percentages tell a much clearer story than raw numbers.
GROUP BY c.contract_type
This tells SQL:
“Do all these calculations per contract type”
Without this:
SQL wouldn’t know how to group the counts and sums.
ORDER BY churn_rate_pct DESCORDER BY churn_rate_pct DESC;
Sorts results from highest churn to lowest
Puts the biggest problem at the top
🧠 BA move:
I can immediately say:
“Monthly contracts are our biggest churn risk.”
| contract_type | total_customers | churned_customers | churn_rate_pct |
|---|---|---|---|
| Monthly | 8,000 | 2,400 | 30.00 |
| 12-Month | 5,000 | 400 | 8.00 |
| 24-Month | 3,000 | 90 | 3.00 |
I took this result and:
Presented it in stakeholder workshops
Used it to justify onboarding improvements
Feed it into dashboards
Define targeted retention initiatives
Influence product and pricing decisions
This query doesn’t just “show data” —
it supports a business decision.
Showed churn was highest on monthly contracts
Proved churn wasn’t evenly distributed
Gave evidence to redesign contract terms and onboarding
👉 This shaped the business case, not just a report.
Innovation – Collaboration
We designed custom graphic assets for Deep Sounds Music, a music production company. Collaborating with their team, we delivered a visually striking, modern style that enhances audience engagement and strengthens brand identity.
