“In an increasingly complex business landscape, I have built my experience by supporting organisational change, process optimisation, and technology transformation initiatives across a range of projects. Below is a collection of selected case studies, past projects, and written business analysis documents that reflect the practical work I have delivered throughout my professional experience.
Through stakeholder collaboration, detailed requirements analysis, and structured process evaluation, I have worked to turn complex business problems into clear understanding, well-defined requirements, and practical solutions. The projects and materials presented here demonstrate how my analysis has contributed to successful outcomes across different initiatives and delivery environments.”
Innovation – Collaboration
Client: Confidential Healthcare & Pharmaceutical Services Organization
Role: Business & Data Analyst — SB Pharma Ltd
Project Duration: 5 Months
Industry: Pharmaceutical / Healthcare Operations
SB Pharma Ltd was contracted by a healthcare and pharmaceutical services client to support a large-scale data consolidation and validation initiative after the organization experienced ongoing reporting inconsistencies, fragmented datasets, and operational inefficiencies caused by disconnected reporting systems.
The client managed operational, compliance-related, and client reporting information across multiple departments using:
Excel spreadsheets
CSV exports
PDF reports
Email attachments
Shared drives
Legacy tracking files
Departmental databases
Because each department maintained its own reporting structure and data standards, the organization experienced:
Duplicate datasets
Inconsistent reporting outputs
Conflicting information across systems
Missing and incomplete records
Unstructured data formats
Delays in validation and reporting cycles
Time-consuming manual reconciliation activities
The objective of the project was to consolidate multiple data sources into structured master datasets, improve data consistency, validate critical reporting fields, and create standardized reporting processes that would improve operational visibility and reporting reliability.
Consolidate data from multiple reporting sources
Perform large-scale data cleansing and validation
Extract information from PDF and exported reports
Standardize datasets and reporting formats
Identify duplicate and incomplete records
Coordinate with stakeholders to validate information
Develop structured reporting templates and dashboards
Improve reporting workflows and data governance practices
The client’s data environment was highly fragmented.
| Source | Format | Description |
|---|---|---|
| Department Reports | XLSX / CSV | Operational and tracking reports |
| Legacy Tracking Files | XLS | Historical reporting logs |
| Shared Drives | PDF / Excel | Compliance and operational documents |
| Email Attachments | PDF / CSV | Updated reports from departments |
| Internal Databases | Exported CSV | Transaction and operational data |
| Client Reporting Files | XLSX | Monthly reporting submissions |
| Product_ID | Product_Name | Region |
|---|---|---|
| PRD001 | Product A | UK |
| ProductCode | Name | Market |
|---|---|---|
| PRD001 | PRODUCT A | United Kingdom |
Different column naming conventions
Inconsistent product naming
Different country formats
Difficult to merge datasets accurately
| Product_ID | Product_Name | Owner | Approval_Date |
|---|---|---|---|
| PRD100 | Product X | NULL | 12/02/2024 |
| PRD101 | NULL | Operations | NULL |
Missing ownership information
Incomplete reporting fields
Reduced reporting accuracy
| Product_ID | Version | Status |
|---|---|---|
| PRD201 | v1 | Approved |
| PRD201 | v1 | Approved |
| PRD201 | v2 | Draft |
Duplicate approved records
Multiple versions stored across departments
Confusion regarding latest approved records
The first stage involved collecting all reporting files and consolidating them into a controlled working environment.
The client supplied:
Excel spreadsheets (.xlsx)
CSV exports from operational systems
Legacy XLS files
PDF reports
Shared drive folder exports
Email reporting attachments
Data was imported using:
Excel → Data Tab → Get Data
Import sources included:
From Workbook
From CSV
From Folder
From Text
Product_ID,Product_Name,Status,Region
PRD001,Product A,Approved,UK
PRD002,PRODUCT A,Draft,United Kingdom
Power Query was used to automate the consolidation of multiple files.
Get Data → From Folder
↓
Combine Files
↓
Standardize Column Names
↓
Remove Blank Rows
↓
Transform Data Types
↓
Load Into Master Dataset
The following standardization activities were performed:
| Problem | Solution |
|---|---|
| Different column names | Standardized headers |
| Mixed date formats | Converted to YYYY-MM-DD |
| Inconsistent regions | Standardized region values |
| Blank rows | Removed |
| Duplicate columns | Consolidated |
Once the datasets were imported, the next phase focused on improving data quality.
Conditional Formatting
COUNTIF()
Remove Duplicates Tool
=COUNTIF(A:A,A2)>1
This highlighted duplicate Product IDs.
SQL queries were used to identify duplicate and incomplete records.
SELECT Product_ID, COUNT(*)
FROM Client_Records
GROUP BY Product_ID
HAVING COUNT(*) > 1;
| Product Name |
|---|
| PRODUCT A |
| Prod-A |
| ProductA |
| Product Name |
|---|
| Product A |
Validation trackers were created to monitor unresolved records.
| Product ID | Missing Field | Assigned Team | Status |
|---|---|---|---|
| PRD100 | Owner | Operations | Pending |
| PRD101 | Approval Date | Compliance | Closed |
Several operational reports were only available as PDFs.
Monthly operational reports
Compliance summaries
Validation logs
Client reporting packs
For smaller reports:
Opened PDFs
Copied structured tables into Excel
Standardized formatting
Python and Pandas were used to structure exported datasets.
import pandas as pd
file = pd.read_csv('client_report.csv')
file.head()
Removed duplicate rows
Removed null values
Renamed columns
Converted date formats
Standardized text formatting
Reconciled conflicting values
Once cleansed, the datasets were consolidated into centralized reporting tables.
Import Files
↓
Clean & Standardize Data
↓
Merge Datasets
↓
Validate Records
↓
Create Master Dataset
↓
Generate Reporting Tables
| Product_ID | Product_Name | Region | Status | Owner |
|---|---|---|---|---|
| PRD001 | Product A | UK | Approved | Regulatory |
| PRD002 | Product B | Germany | Draft | Operations |
The project required continuous collaboration with multiple departments.
Operations Team
Compliance Team
Commercial Team
External Client Contacts
Reporting Teams
Identify Data Issue
↓
Assign To Relevant Team
↓
Validate Information
↓
Update Master Dataset
↓
Close Validation Task
| Issue ID | Description | Assigned Team | Status |
|---|---|---|---|
| 001 | Missing Region Data | Operations | Closed |
| 002 | Duplicate Product Record | Compliance | Pending |
Once the master datasets were finalized, dashboards and reporting templates were created.
Duplicate Record Tracking
Missing Data Monitoring
Validation Progress
Regional Reporting Status
Reporting Completion Rates
| KPI | Result |
|---|---|
| Duplicate Records Removed | 1,500+ |
| Files Consolidated | 4,000+ |
| Missing Fields Resolved | 90% |
| Reporting Accuracy Improvement | Significant Reduction In Errors |
The project successfully improved the client’s operational reporting and data management processes.
Consolidated fragmented datasets into centralized reporting structures
Improved data consistency and reporting accuracy
Reduced duplicate and incomplete records
Standardized reporting formats and naming conventions
Improved data visibility across departments
Reduced manual reconciliation effort
Enhanced reporting reliability and operational efficiency
| Technology | Purpose |
|---|---|
| Excel | Data cleansing, validation, reporting |
| Power Query | Data import and transformation |
| SQL | Data validation and reconciliation |
| Power BI | Dashboard reporting and KPI monitoring |
| Python (Pandas) | Data structuring and cleansing |
Data Consolidation & Structuring
Data Cleansing & Validation
Reporting Standardization
Data Reconciliation
Stakeholder Coordination
Process Improvement
Dashboard Development
Data Governance Support
Operational Reporting
Data Quality Management
This project demonstrates my ability to consolidate and structure large volumes of fragmented operational and compliance-related data from multiple sources while improving reporting quality, validation processes, and stakeholder collaboration.
The experience strengthened my ability to:
Work with complex multi-source datasets
Improve data consistency and governance
Manage validation workflows
Build structured reporting environments
Support operational and compliance-focused reporting
Coordinate effectively with cross-functional stakeholders
It also demonstrates practical experience handling real-world data quality and reporting challenges within regulated and fast-paced business environments.
Innovation – Collaboration
Client: Confidential Pharmaceutical & Healthcare Services Organization
Role: Business & Data Analyst — SB Pharma Ltd
Project Duration: 6 Months
Industry: Pharmaceutical / Healthcare Operations
SB Pharma Ltd was engaged by a pharmaceutical and healthcare services client to support a compliance reporting and process improvement initiative after the organization identified ongoing reporting inefficiencies, inconsistent operational data, and poor reporting visibility across multiple departments.
The client relied heavily on manual reporting processes using:
Excel spreadsheets
Shared drives
CSV exports
Email reporting chains
Legacy tracking files
Operational databases
Compliance monitoring reports
Because reporting activities were managed independently by different teams, the organization experienced:
Inconsistent reporting outputs
Duplicate and outdated records
Delays in monthly reporting cycles
Poor version control
Missing and incomplete data fields
Difficulties tracking compliance activities
Time-consuming manual reconciliation processes
Lack of standardized reporting structures
The objective of the project was to improve compliance-related reporting processes, standardize reporting structures, improve data quality, and create a more efficient and reliable reporting environment.
Analyse operational and compliance-related datasets
Consolidate data from multiple reporting systems
Identify reporting inconsistencies and data quality issues
Standardize reporting templates and data structures
Improve document organization and reporting workflows
Coordinate with stakeholders to validate reporting data
Build dashboards and reporting trackers
Support process improvement and data governance initiatives
The client maintained reporting information across multiple disconnected systems.
| Source | Format | Description |
|---|---|---|
| Monthly Operational Reports | XLSX / CSV | Department reporting data |
| Shared Drives | Excel / PDF | Compliance documentation |
| Email Attachments | CSV / XLSX | Updated reporting files |
| Legacy Tracking Logs | XLS | Historical reporting records |
| Internal Databases | CSV Exports | Operational system data |
| Compliance Reports | Monthly compliance summaries |
| Product_ID | Cases_Closed | Region |
|---|---|---|
| PRD001 | 52 | UK |
| ProductCode | Closed_Cases | Country |
|---|---|---|
| PRD001 | 52 | United Kingdom |
Different column names
Different region naming formats
Inconsistent report structures
Difficult consolidation process
| Product_ID | Reporting_Month | Status | Owner |
|---|---|---|---|
| PRD020 | April | Closed | NULL |
| PRD021 | NULL | Open | Compliance |
Missing reporting periods
Incomplete ownership information
Reduced reporting accuracy
| Product_ID | Report_Date | Status |
|---|---|---|
| PRD300 | 01/04/2024 | Closed |
| PRD300 | 01/04/2024 | Closed |
Duplicate records inflated reporting totals
Manual reporting errors impacted dashboards
The first phase involved reviewing the client’s reporting environment and understanding how operational and compliance data was being managed.
Collected reporting files from multiple departments
Reviewed folder structures and reporting workflows
Identified inconsistencies across reporting templates
Mapped data sources and reporting dependencies
Assessed reporting quality issues and duplication levels
The client supplied:
Excel workbooks (.xlsx)
CSV exports from operational systems
Legacy XLS tracking files
PDF compliance summaries
Shared drive reporting folders
Email reporting attachments
All reporting files were consolidated into a centralized working environment.
Excel → Data Tab → Get Data
Import sources included:
From Workbook
From CSV
From Folder
From Text
Product_ID,Region,Status,Owner
PRD001,UK,Closed,Operations
PRD002,United Kingdom,Open,Compliance
Power Query was used to automate data consolidation.
Get Data → From Folder
↓
Combine Files
↓
Transform Columns
↓
Remove Blank Rows
↓
Standardize Formats
↓
Load Into Reporting Dataset
| Problem | Solution |
|---|---|
| Different column names | Standardized headers |
| Mixed date formats | Standardized dates |
| Duplicate fields | Consolidated records |
| Blank rows | Removed |
| Region inconsistencies | Standardized values |
After importing the data, cleansing and validation activities were performed.
Conditional Formatting
COUNTIF()
Remove Duplicates Tool
=COUNTIF(A:A,A2)>1
SQL queries were used to validate reporting datasets.
SELECT Product_ID, COUNT(*)
FROM Compliance_Reports
GROUP BY Product_ID
HAVING COUNT(*) > 1;
| Region |
|---|
| UK |
| United Kingdom |
| U.K |
| Region |
|---|
| United Kingdom |
Validation logs were used to track incomplete reporting records.
| Product_ID | Missing Field | Assigned Team | Status |
|---|---|---|---|
| PRD020 | Owner | Operations | Pending |
| PRD021 | Reporting Month | Compliance | Closed |
The project focused heavily on improving reporting consistency and reducing manual effort.
Manual File Collection
↓
Manual Data Copying
↓
Manual Validation
↓
Manual Reporting
↓
Email Distribution
High manual effort
Increased reporting errors
Slow reporting cycles
Difficult reconciliation process
Automated File Imports
↓
Standardized Templates
↓
Centralized Validation
↓
Structured Reporting Tables
↓
Dashboard Reporting
Standardized reporting templates
Centralized reporting datasets
Validation procedures for incomplete records
Improved folder structures and naming conventions
Reduced manual consolidation activities
Power BI dashboards were developed to improve visibility into reporting quality and operational performance.
Duplicate Reporting Records
Missing Data Tracking
Validation Completion Rates
Reporting Status Monitoring
Monthly Compliance Reporting Trends
| KPI | Result |
|---|---|
| Duplicate Records Removed | 1,000+ |
| Reports Standardized | 3,500+ |
| Missing Fields Resolved | 88% |
| Reporting Cycle Time Reduction | Significant Improvement |
Continuous collaboration with stakeholders was required throughout the project.
Compliance Team
Operations Team
Reporting Team
Commercial Team
External Client Contacts
Identify Reporting Issue
↓
Assign To Relevant Team
↓
Validate Information
↓
Update Reporting Dataset
↓
Close Validation Task
| Issue ID | Description | Assigned Team | Status |
|---|---|---|---|
| 001 | Duplicate Monthly Report | Reporting Team | Closed |
| 002 | Missing Region Data | Operations | Pending |
The project successfully improved reporting quality, operational visibility, and compliance-related reporting processes.
Improved reporting consistency across departments
Reduced duplicate and incomplete reporting records
Standardized reporting templates and structures
Improved reporting visibility and dashboard accuracy
Reduced manual reconciliation effort
Improved operational reporting efficiency
Enhanced data governance and reporting controls
| Technology | Purpose |
|---|---|
| Excel | Data cleansing, validation, reporting |
| Power Query | Data import and transformation |
| SQL | Validation and reconciliation queries |
| Power BI | Dashboard reporting and KPI monitoring |
| Python (Pandas) | Data structuring and transformation |
Compliance Reporting
Data Cleansing & Validation
Reporting Standardization
Dashboard Development
Stakeholder Coordination
Data Governance Support
Process Improvement
Data Consolidation
Data Quality Management
Reporting Workflow Optimization
This project demonstrates my ability to improve compliance-related reporting processes by consolidating fragmented datasets, standardizing reporting structures, improving data quality, and supporting data governance initiatives within regulated environments.
The experience strengthened my ability to:
Work with large operational and reporting datasets
Improve reporting accuracy and consistency
Build structured reporting environments
Develop dashboards and KPI reporting tools
Coordinate with multiple stakeholders
Support process improvement and governance activities
It also reflects practical experience improving operational reporting efficiency and managing complex reporting workflows within fast-paced pharmaceutical and healthcare environments.
Innovation – Collaboration
This project demonstrates a complete end-to-end data cleaning workflow in Microsoft Excel using real-world data quality techniques commonly used by data analysts before importing data into SQL databases, Power BI dashboards, Tableau, or Python workflows.
The project was inspired by the practical Excel data cleaning techniques and focuses on preparing raw, inconsistent data into a structured, analysis-ready dataset.
The objective of the project was to:
Raw business datasets often contain inconsistent formatting, duplicate records, missing information, and unstructured text values that reduce reporting accuracy and create problems when importing data into systems such as:
Without proper cleansing:
This project focused on resolving those issues using Excel-based cleaning techniques.
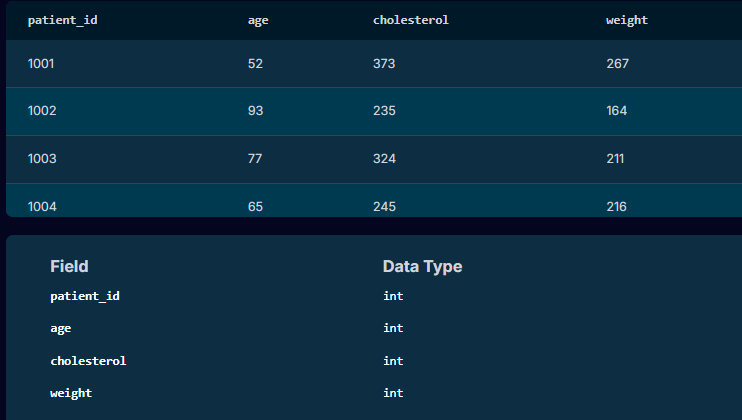
The project used a modified U.S. Presidents dataset containing intentionally introduced data quality issues to simulate real-world messy business data.
| President | Party | Vice President | Net Worth | Date |
|---|---|---|---|---|
| JAMES MONROE | democratic-republican | daniel d. tompkins | $1,200,000 | 1/2/1820 |
| james monroe | democratic republican | Daniel D. Tompkins | $1,200,000 | 1820-01-02 |
| Barack Obama | Democrat | Joe Biden | $40,000,000 | 01-20-2009 |
The first step involved reviewing the dataset to identify obvious data quality problems.
Remove duplicate records that could distort reporting and analysis.
Data Tab → Remove Duplicates
Excel automatically compared all selected columns and identified rows containing identical information.
| President | Party |
|---|---|
| Barack Obama | Democrat |
| Barack Obama | Democrat |
| President | Party |
|---|---|
| Barack Obama | Democrat |
Duplicate records can:
This step is especially important when working with datasets containing thousands of records.
Ensure all text values followed a consistent format.
| Raw Values |
|---|
| JAMES MONROE |
| james monroe |
| James Monroe |
=PROPER(A2)
Converted text into standardized proper case formatting.
=UPPER(A2)
Converted text to uppercase when needed.
| Cleaned Value |
|---|
| James Monroe |
Consistent formatting improves:
Standardize category labels and correct inconsistencies.
| Raw Values |
|---|
| Republican |
| Republicans |
| democratic republican |
| democratic-republican |
Data → Filter
Filters were used to identify inconsistent category values.
| Before | After |
|---|---|
| Republicans | Republican |
| democratic republican | Democratic-Republican |
Without standardization:
Remove hidden spaces that could break filtering, matching, or SQL imports.
| Raw Values |
|---|
| John Smith |
| John Smith |
| John Smith |
Extra spaces are often invisible but create major matching issues.
=TRIM(A2)
Additional spaces can:
Convert currency-formatted fields into usable numeric values.
| Raw Values |
|---|
| $1,200,000 |
| £450,000 |
Format Cells → Number
Currency symbols and unnecessary formatting were removed.
When importing into SQL or reporting tools:
Ensure all date fields followed one consistent format.
| Raw Dates |
|---|
| 1/2/1820 |
| 1820-01-02 |
| 01-02-1820 |
Format Cells → Short Date
YYYY-MM-DD
Date inconsistencies can:
Replace formulas with permanent cleaned values.
Copy → Paste Special → Values
This removes dependency on formulas and creates:
Simplify the dataset by removing irrelevant or redundant columns.
Removing unnecessary columns:
| President | Party | Vice President | Net Worth | Date |
|---|---|---|---|---|
| James Monroe | Democratic-Republican | Daniel D. Tompkins | 1200000 | 1820-01-02 |
| Barack Obama | Democrat | Joe Biden | 40000000 | 2009-01-20 |
| Technology | Purpose |
|---|---|
| Microsoft Excel | Data cleansing & transformation |
| Excel Functions | Standardization & validation |
| Filters & Sorting | Error identification |
| Conditional Formatting | Duplicate detection |
| Paste Special | Static value conversion |
This project demonstrates practical experience cleaning and standardizing messy real-world datasets using Microsoft Excel.
The techniques used mirror the types of data quality improvement activities commonly performed in:
The project also highlights the importance of understanding how data will be used downstream in SQL databases, Power BI dashboards, Python workflows, and reporting systems before performing cleansing and transformation activities.
Innovation – Collaboration
This project demonstrates how to import, clean, transform, and structure PDF-based data directly into Microsoft Excel using Power Query.
Organizations frequently publish:
in PDF format rather than structured Excel or database files.
This creates major challenges because:
The objective of this project was to automate the process using Power Query.
The source file was a Tesla quarterly shareholder PDF report downloaded from:
Tesla Investor Relations.
| Metric | Q1 | Q2 | Q3 |
|---|---|---|---|
| Revenue | 1000 | 1200 | 1400 |
| Gross Margin % | 20% | 21% | 19% |
| Operating Expenses | 400 | 420 | 450 |
The table contained:
| Technology | Purpose |
|---|---|
| Microsoft Excel | Data analysis |
| Power Query | Data extraction & cleansing |
| PDF Financial Reports | Source data |
| Excel Tables | Reporting structure |
Demonstrate the limitations of manual PDF extraction.
Select PDF Table
↓
CTRL + C
↓
Paste Into ExcelWhen pasted directly into Excel:
| Raw Pasted Data |
|---|
| Revenue 1000 1200 1400 |
Manual extraction:
Use Microsoft Word to preserve table formatting.
Copy PDF Table
↓
Paste Into Microsoft Word
↓
Select Table
↓
Copy Table
↓
Paste Into ExcelMicrosoft Word automatically recognized the copied content as a structured table.
This method works for:
But struggles with:
Use Power Query to automate PDF extraction and cleanup.
Data → Get Data → From File → From PDFPower Query:
Power Query displayed:
The correct table was identified by:
Table004Open the dataset inside Power Query Editor for cleansing.
Transform Data| Step | Purpose |
|---|---|
| Source | Connected to PDF |
| Navigation | Selected table |
| Promoted Headers | Used first row as headers |
| Changed Type | Assigned data types |
Power Query automatically:
Remove null or blank rows.
Filter Dropdown → Remove Empty| Revenue | Q1 |
|---|---|
| NULL | NULL |
| Revenue | Q1 |
|---|---|
| Revenue | 1000 |
Import transformed data into Excel.
Close & Load To| Setting | Value |
|---|---|
| Output Type | Table |
| Destination | Existing Worksheet |
The PDF table became a structured Excel table ready for:
Perform advanced transformations to remove unwanted percentage rows and normalize the dataset.
The percentage values needed to remain as text temporarily so Power Query could identify:
%The automatically generated:
Changed Typestep was removed.
Preserve original row order during transformations.
Add Column → Index Column → From 1Unpivoting changes row ordering.
The index allowed:
YOY (Year on Year)The project only required raw financial values.
Convert cross-tab data into transactional row format.
| Metric | Q1 | Q2 |
|---|---|---|
| Revenue | 1000 | 1200 |
Unpivot Other Columns| Metric | Quarter | Value |
|---|---|---|
| Revenue | Q1 | 1000 |
| Revenue | Q2 | 1200 |
Normalized data works better for:
Remove rows containing percentage metrics.
Does Not Contain "%"| Metric |
|---|
| Gross Margin % |
| Operating Margin % |
Data Type → Decimal NumberThis enabled:
Return the data to a cross-tab reporting structure.
Transform → Pivot Column| Metric | Q1 | Q2 |
|---|---|---|
| Revenue | 1000 | 1200 |
| Operating Expenses | 400 | 420 |
A fully cleaned and structured Excel dataset suitable for:
This workflow significantly reduced:
It also improved:
These techniques are highly applicable to:
This project demonstrates practical experience using Power Query within Microsoft Excel to automate the extraction, cleansing, normalization, and transformation of PDF-based business reports into structured analytical datasets.
The techniques used are directly relevant to:
Innovation – Collaboration
During a clinical trial the Principal Investigator notified the team that she has seen an uptick in heart attacks for his patients over the past few months. She has been noticing some trends across his patients and wanted to get ahead of things by reaching out to current patients who are at a high risk of a heart attack.
So, we needed to identify which patient she needs to reach out to and provide that information to her.
In summary, the SQL query written for the Doctor:
Innovation – Collaboration
Below are BA-style SQL queries I’ve used on projects. I’ll explain why I ran each query, what question I was answering, and how it influenced the project.
“Who is churning, and when does it happen?”
SELECT
c.contract_type,
COUNT(*) AS total_customers,
SUM(CASE WHEN c.churn_flag = 'Y' THEN 1 ELSE 0 END) AS churned_customers,
ROUND(
SUM(CASE WHEN c.churn_flag = 'Y' THEN 1 ELSE 0 END) * 100.0 / COUNT(*),
2
) AS churn_rate_pct
FROM customers c
GROUP BY c.contract_type
ORDER BY churn_rate_pct DESC;
FROM customers cFROM customers c
This tells SQL we’re querying the customers table.
c is an alias — it makes the query shorter and easier to read.
🧠 BA thinking:
“This table should have one row per customer with contract and churn info.”
SELECT c.contract_type,
This groups customers by contract type
(e.g. Monthly, 12-Month, 24-Month)
🧠 BA insight:
“I want to compare churn across different contract models.”
COUNT(*) AS total_customersCOUNT(*) AS total_customers,
Counts how many customers are in each contract type.
COUNT(*) counts all rows in that group.
📊 Example output:
| contract_type | total_customers |
|---|---|
| Monthly | 8,000 |
| 12-Month | 5,000 |
🧠 Why I need this:
I can’t talk about churn percentages without knowing the base size.
SUM(CASE WHEN c.churn_flag = ‘Y’ THEN 1 ELSE 0 END)
SUM(CASE WHEN c.churn_flag = ‘Y’ THEN 1 ELSE 0 END) AS churned_customers,
CASE checks each customer:
If churn_flag = 'Y' → count as 1
Otherwise → count as 0
SUM() adds them up per contract type.
📊 Example:
| contract_type | churned_customers |
|---|---|
| Monthly | 2,400 |
| 12-Month | 400 |
🧠 BA translation:
“How many customers actually left under each contract?”
ROUND( churned / total * 100, 2 )
ROUND(
SUM(CASE WHEN c.churn_flag = ‘Y’ THEN 1 ELSE 0 END) * 100.0 / COUNT(*),
2
) AS churn_rate_pct
SUM(CASE WHEN churn_flag = ‘Y’ THEN 1 ELSE 0 END)
→ number of churned customers
2. Denominator:
COUNT(*)
→ total customers
3. Multiply by 100.0
Forces decimal calculation (important!)
Avoids integer division (e.g. 1/10 = 0)
4. ROUND(..., 2)
Rounds to 2 decimal places
Makes it presentation-ready for stakeholders
| contract_type | churn_rate_pct |
|---|---|
| Monthly | 30.00 |
| 12-Month | 8.00 |
🧠 Why this matters:
Percentages tell a much clearer story than raw numbers.
GROUP BY c.contract_type
This tells SQL:
“Do all these calculations per contract type”
Without this:
SQL wouldn’t know how to group the counts and sums.
ORDER BY churn_rate_pct DESCORDER BY churn_rate_pct DESC;
Sorts results from highest churn to lowest
Puts the biggest problem at the top
🧠 BA move:
I can immediately say:
“Monthly contracts are our biggest churn risk.”
| contract_type | total_customers | churned_customers | churn_rate_pct |
|---|---|---|---|
| Monthly | 8,000 | 2,400 | 30.00 |
| 12-Month | 5,000 | 400 | 8.00 |
| 24-Month | 3,000 | 90 | 3.00 |
I took this result and:
Presented it in stakeholder workshops
Used it to justify onboarding improvements
Feed it into dashboards
Define targeted retention initiatives
Influence product and pricing decisions
This query doesn’t just “show data” —
it supports a business decision.
Showed churn was highest on monthly contracts
Proved churn wasn’t evenly distributed
Gave evidence to redesign contract terms and onboarding
👉 This shaped the business case, not just a report.
Innovation – Collaboration
Project: Production Optimization & Cost Control for Onshore Oil Fields
Our company was facing declining production in several mature oil fields while operating costs were increasing. Management needed a clear, data-driven view of:
Which wells were underperforming
Where downtime was causing production losses
How much revenue was being lost due to equipment failures and delays
The data existed, but it was scattered across multiple systems:
Production system (daily oil, gas, water volumes)
Maintenance system (equipment failures, work orders, downtime)
ERP/Finance system (operating costs, budgets, revenue)
My role as a Business Analyst was to use SQL to integrate these systems, analyze the data, and provide insights to operations and leadership.
I wrote SQL queries that joined tables across systems using keys such as Well_ID, Field_ID, and Date.
Example tasks:
Join daily production data with downtime records
Link maintenance work orders with production loss
Combine cost data with production volumes
This created a single, trusted dataset for analysis.
Using SQL aggregations and window functions, I:
Calculated daily, monthly, and yearly production
Compared actual vs. target production
Ranked wells by performance using RANK() and ROW_NUMBER()
Business insight:
We discovered that 15% of wells were responsible for over 40% of total production losses.
I used SQL to:
Calculate total downtime per well
Classify downtime by root cause (mechanical, electrical, human error)
Compute lost barrels = downtime hours × average production rate
Business insight:
A single compressor failure was causing over $2M per year in lost production.
By joining production and cost tables, I calculated:
Lifting cost per barrel
Well-level profitability
Budget vs. actual variances
Business insight:
Some wells were producing oil at a higher cost than their market value, leading to operational losses.
I used SQL to:
Identify missing production values
Detect duplicate downtime entries
Flag wells with abnormal production spikes
This improved trust in reports used by engineers and management.
From my SQL datasets, I:
Fed clean data into Power BI dashboards
Created operational reports for engineers
Provided executive summaries for leadership
Reduced unplanned downtime by 18%
Improved production forecasting accuracy
Identified cost-saving opportunities worth millions annually
Enabled data-driven decisions for field optimization
Role: Business Analyst
Project: Production Loss & Cost Optimization for Onshore Oil Fields
The company was losing revenue due to:
High unplanned downtime
Underperforming wells
Rising operating costs
Data existed in three systems:
Production database
Maintenance system
Finance/ERP system
My task was to use SQL to integrate the data, analyze root causes, and provide management insights.
| well_id | prod_date | oil_bbl | gas_mcf | water_bbl |
|---|---|---|---|---|
| W01 | 2024-01-01 | 520 | 300 | 120 |
| W01 | 2024-01-02 | 0 | 0 | 0 |
| W02 | 2024-01-01 | 210 | 140 | 90 |
| W02 | 2024-01-02 | 190 | 130 | 85 |
| well_id | dt_date | hours_down | cause |
|---|---|---|---|
| W01 | 2024-01-02 | 24 | Mechanical |
| W02 | 2024-01-02 | 6 | Electrical |
| well_id | cost_date | operating_cost_usd |
|---|---|---|
| W01 | 2024-01-01 | 8000 |
| W01 | 2024-01-02 | 7800 |
| W02 | 2024-01-01 | 4200 |
| W02 | 2024-01-02 | 4000 |
SELECT
p.well_id,
p.prod_date,
p.oil_bbl,
d.hours_down,
d.cause
FROM production_daily p
LEFT JOIN downtime_log d
ON p.well_id = d.well_id
AND p.prod_date = d.dt_date;
Insight:
Well W01 produced zero oil on 2024-01-02 due to 24 hours of mechanical downtime.
SELECT
d.well_id,
d.dt_date,
d.hours_down,
ROUND(AVG(p.oil_bbl) / 24 * d.hours_down, 2) AS lost_oil_bbl
FROM downtime_log d
JOIN production_daily p
ON d.well_id = p.well_id
GROUP BY d.well_id, d.dt_date, d.hours_down;
Insight:
W01 lost ~520 barrels in one day from downtime.
SELECT
well_id,
SUM(oil_bbl) AS total_oil
FROM production_daily
GROUP BY well_id
HAVING SUM(oil_bbl) < 300;
Insight:
W02 is producing significantly less oil than W01.
SELECT
p.well_id,
SUM(c.operating_cost_usd) / NULLIF(SUM(p.oil_bbl),0) AS cost_per_barrel
FROM production_daily p
JOIN well_costs c
ON p.well_id = c.well_id
AND p.prod_date = c.cost_date
GROUP BY p.well_id;
Insight:
Some wells were producing at a higher cost than market oil price → candidates for optimization or shut-in.
SELECT
cause,
SUM(hours_down) AS total_hours
FROM downtime_log
GROUP BY cause
ORDER BY total_hours DESC;
Insight:
Mechanical failures were the top cause of production loss.
Identified wells causing 40% of production losses
Linked downtime directly to revenue loss
Flagged high-cost, low-output wells
Enabled management to prioritize maintenance and optimize field performance
Innovation – Collaboration
In business analytics, Waterfall and Agile are two distinct methodologies used for managing projects. Each has its own strengths and is suited to different types of business environments and project needs.
Add a “Spend Tracker” feature to a bank’s mobile app that categorizes customer transactions and offers spending insights.
The client which was a traditional bank with strict regulatory and security controls opted for the Waterfall methodology.
Requirement Gathering (BA Role)
Conduct detailed stakeholder interviews and workshops.
Documents everything in a Business Requirements Document (BRD) and Functional Requirements Document (FRD).
These are reviewed, revised, and signed off.
Design
The technical part of the team designs the system based entirely on the signed-off documents.
Development
Work with the developers code the full feature as per specs. No major changes are accepted mid-project.
Testing
Team up with the QA to test the complete system against original specs using test cases written from the FRD.
Deployment
The final product is released only after all phases are complete.
Clear roadmap
Thorough documentation
Easy to measure progress
Slow to deliver value
Inflexible to changes
Risk of misaligned outcomes if initial assumptions were off
A fintech start-up wants to implement the Spend Tracker in their mobile app. They use Agile for speed and flexibility.
Sprint Planning (BA Role)
Worked with the Product Owner and team to break the features into small user stories (e.g., “As a user, I want to see my spending by category”).
Incremental Delivery
Myself and the Developers build and release small parts of the feature every 2 weeks (sprint).
I would then refine and update requirements as feedback comes in.
Daily Stand-ups & Backlog Grooming
Continuous collaboration with the team to clarify or adjust requirements.
Iterative Testing
BA & QA tests in each sprint.
Changes and improvements happen continuously.
Frequent Releases
Users start seeing value after the first few sprints rather than waiting months.
Fast feedback loops
Highly adaptable
Early value delivery
Less formal documentation
Requires high team involvement
Scope creep can be a risk if not managed well
Aspect | Waterfall | Agile |
Project Structure | Sequential (phases: plan → build → test) | Iterative (sprints/cycles) |
BA Involvement | Front-loaded | Continuous |
Documentation | Extensive (BRD, FRD, RTM, etc.) | Lightweight (User Stories, AC) |
Change Handling | Difficult once dev starts | Expected and welcomed |
Delivery Timeline | One big release at end | Frequent small releases |
Stakeholder Engagement | At milestones | Ongoing and active |
Best For | Fixed-scope, compliance-heavy projects | Innovative, evolving, user-focused work |
Use Waterfall for: Government systems, infrastructure projects, banking/insurance/pharmaceutical/oil and gas compliance.
Use Agile for: Customer-facing apps, SaaS tools, products with fast-changing requirements.
Innovation – Collaboration
A Service Level Requirement Agreement (SLRA) defines the expected level of service between a service provider (e.g., IT, third-party vendor) and a business unit. It outlines measurable performance metrics like uptime, response time, resolution time, data availability, and more. In Business Analytics, an SLRA ensures that data platforms, reporting tools, and analytics systems perform reliably and meet business needs.
A national retail chain is launching a new Business Intelligence (BI) dashboard to monitor store performance and customer behavior. The business analyst is responsible for documenting an SLRA between the Data Engineering team (internal service provider) and the Marketing and Operations departments (end users).
Section | Description | Example |
1. Purpose & Scope | Define why the SLRA is needed and what systems or services it covers. | Covers BI dashboard availability, data refresh rate, and report delivery timelines. |
2. Service Description | Detailed explanation of what service is being provided. | Daily dashboard updates, real-time campaign performance reports. |
3. Service Hours | When services will be available. | BI dashboards available from 6:00 AM – 10:00 PM, Mon–Sun. |
4. Performance Metrics | Define key SLAs (Service Level Agreements). | – Uptime: 99.5% monthly
– Daily refresh complete by 7:00 AM
– Report generation in under 10 seconds |
5. Incident Management | Define how issues are reported and resolved. | – Critical issue response: within 1 hour
– Medium issue: within 4 hours
– Resolution: within 24 hours |
6. Data Accuracy & Quality | Agree on data integrity expectations. | 98% accuracy for transactional data; daily data validation logs reviewed. |
7. Dependencies | Note any technical or operational dependencies. | Relies on the POS system exporting data before 2:00 AM. |
8. Reporting & Monitoring | How performance is monitored and communicated. | Monthly SLA reports reviewed in Ops-MIS meetings. |
9. Escalation Path | Escalation contacts and hierarchy. | Step-by-step contact protocol from analyst to senior management. |
10. Review Cycle | How often the SLRA is reviewed. | Reviewed quarterly with both parties. |
11. Approval & Sign-off | Stakeholder signatures and dates. | Signed by IT Manager, Marketing Director, and Business Analyst. |
Conduct Stakeholder Interviews
Meet with service providers and users to understand expectations.
Gather technical capabilities and business needs.
Document Requirements
Use clear, measurable terms (e.g., response time = 2 hours).
Avoid vague language like “as soon as possible.”
Facilitate Workshops
Align technical feasibility with business expectations.
Use whiteboards or shared documents to collaborate.
Draft the SLRA
Write in formal language, using a business-oriented structure.
Include appendices for detailed KPIs or escalation charts.
Review & Sign Off
Circulate for feedback.
Obtain formal approval from key stakeholders.
Document Title: Service Level Requirement Agreement – BI DashboardVersion: 1.0Prepared by: [Your Name], Business AnalystDate: 23 May 2025Status: Approved
MS Word or Google Docs – Document drafting
Confluence – Live documentation & collaboration
Smartsheet or Excel – SLA metric tracking
Jira/ServiceNow – Issue tracking & response metrics
Innovation – Collaboration
A Data Management Plan (DMP) is a structured document that outlines how data will be collected, stored, protected, shared, and archived throughout the lifecycle of a business analytics project. It’s essential for ensuring data integrity, compliance, security, and usability, especially in projects involving sensitive or large-scale data.
A UK-based financial services company is implementing a customer analytics platform to gain insights into client behavior, transaction trends, and product engagement.
The Business Analyst is responsible for developing a Data Management Plan (DMP) to ensure that data from multiple internal systems (CRM, transaction databases, web logs) is handled properly.
Below is a section-by-section breakdown of a DMP a Business Analyst might create:
Project name and description
Purpose of the data (e.g., customer segmentation, fraud detection)
Sources: CRM, ERP, call center logs, website analytics
Types of data: structured (SQL databases), semi-structured (JSON logs), unstructured (audio transcripts)
Tools used: ETL tools like Talend, Informatica, or custom scripts
Data cleansing procedures (handling duplicates, nulls, outliers)
Validation steps (e.g., data profiling, anomaly detection)
Ownership/responsibilities for data accuracy
Define how data fields will be labeled, tagged, and categorized
Use of data dictionaries and naming conventions
Where data will be stored (cloud vs. on-prem)
Security controls (encryption, access controls, firewall rules)
Compliance with GDPR, UK Data Protection Act, or other relevant laws
Who has access (internal teams, partners, third parties)
User roles and permissions
API integrations and dashboards for data access
How long data will be retained (e.g., 7 years for financial data)
Archiving processes (cold storage, backup schedules)
Secure deletion protocols
Certification or audit trails for deleted data
Identification of risks (data loss, breach, corruption)
Mitigation strategies (regular backups, failover systems)
Frequency of DMP reviews
Responsible stakeholders for updating the plan
Collaborate with data architects, compliance officers, and business stakeholders
Document findings and standards in a clear, structured DMP
Facilitate workshops to validate and approve the plan
Ensure alignment with corporate data governance policies
Document Title: Data Management Plan – Customer Analytics ProjectVersion: 1.2Prepared by: Business AnalystDate: 23 May 2025Status: Approved by Data Governance Board
Innovation – Collaboration
A Vendor Proposal (VP) is a formal document submitted by an external service provider or vendor in response to a company’s Request for Proposal (RFP). It outlines how the vendor intends to meet the business’s needs, including solutions, timelines, pricing, and qualifications.
In business analytics, Vendor Proposals are used when selecting analytics platforms, data warehouses, BI tools, or consulting services.
A UK-based retail company is replacing its outdated reporting system. The Business Analyst (BA), in collaboration with IT and procurement, sends out an RFP to vendors like Tableau, Power BI, and Qlik.
Vendors reply with Vendor Proposals, and the BA helps evaluate and document these proposals.
While the vendor writes the proposal, the Business Analyst evaluates it. Below is what the VP should include:
Executive Summary
Overview of the vendor’s understanding of the client’s needs
High-level solution description
Proposed Solution
Technical and functional features (e.g., dashboarding, real-time data support)
Integration capabilities with current systems (e.g., ERP, CRM)
Project Plan
Timeline of deliverables
Phases (e.g., kickoff, implementation, testing, training)
Team Qualifications
Bios and experience of key personnel
References from similar projects
Cost Breakdown
Software licenses
Implementation fees
Support/maintenance costs
Service Level Agreements (SLAs)
Uptime commitments
Response time for incidents
Legal & Compliance
GDPR adherence
Data privacy and protection policies
As a Business Analyst, you don’t typically write the VP, but you:
✅ Evaluate and summarize vendor submissions✅ Compare them against business and technical requirements✅ Facilitate vendor demos✅ Document findings in a Vendor Proposal Evaluation Matrix
Criteria | Vendor A (Tableau) | Vendor B (Power BI) | Vendor C (Qlik) |
Meets all functional requirements | ✅ | ✅ | ✅ |
Data source integrations | ✅ (strong) | ✅ (limited) | ✅ |
Pricing | £15K/year | £10K/year | £13K/year |
Ease of Use | High | Medium | High |
GDPR Compliance | ✅ | ✅ | ✅ |
Training & Support | 24/7 | Business hours | 24/5 |
Final Score (1–5) | 4.5 | 3.9 | 4.2 |
Vendor Evaluation Summary Document
Executive summary
Key findings from each vendor proposal
Recommendation with rationale
Excel (for scoring matrix)
Word/Google Docs (for report)
Teams/Zoom (vendor demos)
SharePoint or Confluence (for stakeholder sharing
Innovation – Collaboration
Data migration is the process of transferring data from one system or storage format to another. In business analytics, this is a critical activity, especially during system upgrades, cloud transitions, or mergers and acquisitions, where data needs to be moved, transformed, and validated to support ongoing business operations and analytics.
A UK-based retail chain is migrating from a legacy Enterprise Resource Planning (ERP) system to a new cloud-based solution (e.g., SAP or Oracle NetSuite).
Ensure seamless transfer of all critical data—like inventory, customer records, supplier details, and transaction history—into the new system without data loss or integrity issues.
What the BA does:
Identify all data sources involved (e.g., old ERP, spreadsheets, CRM).
Define scope: What data will be migrated (master data, transactional data, historical data)?
Document data ownership, dependencies, and risks.
Collaborate with IT, DBAs, and data stewards.
Deliverable: Data Migration Strategy Document
What the BA does:
Work with technical teams to map fields from the source system to the target system.
Identify gaps, redundant fields, and mismatches.
Capture transformation logic (e.g., combine “First Name” and “Last Name” into “Full Name”).
Deliverable: Data Mapping Document
What the BA does:
Identify and document incomplete, duplicate, or outdated data.
Define rules for data quality improvement before migration.
Tools involved: Excel, SQL, data profiling tools (e.g., Talend, Informatica)
What the BA does:
Define and run test cases to validate that migrated data is accurate and complete.
Work with QA to perform sample validations (e.g., are all customer records present in the new system?).
Deliverable: Data Migration Test Plan
What the BA does:
Coordinate with IT for go-live.
Monitor execution and validate critical data during migration.
Deliverable: Migration Readiness Checklist
What the BA does:
Validate reports and dashboards.
Ensure the business is using accurate data.
Log and resolve data-related issues quickly.
Deliverable: Post-Migration Validation Report
No critical data loss
Data accuracy & completeness
No disruption to business processes
Stakeholder sign-off on migrated data
Data mapping & documentation
Stakeholder coordination
SQL/data analysis
Testing and validation planning
Risk and change management
Innovation – Collaboration
In business analytics, particularly in industries like pharmaceuticals, healthcare, finance, and energy, a Regulatory Affairs Impact Assessment (RAIA) is a critical document used to evaluate the business impact of new or updated regulatory requirements. This ensures that the company remains compliant, while identifying changes needed in processes, systems, documentation, or training.
You’re a Business Analyst working in a UK-based pharmaceutical company. The MHRA (Medicines and Healthcare products Regulatory Agency) has issued new labelling regulations for prescription packaging, effective in 6 months.
Your task is to lead a Regulatory Affairs Impact Assessment (RAIA) to:
Evaluate the scope of impact
Assess business, system, and process changes
Inform relevant stakeholders
Recommend an action plan
A Regulatory Affairs Impact Assessment (RAIA) is a formal document that:
Summarises the new regulatory requirement
Assesses its impact across departments
Identifies gaps between current practice and required standards
Proposes actions to become compliant before the effective date
Brief summary of the regulation and the high-level impact on the business
Regulatory authority (e.g., MHRA, FCA, EMA, OFGEM)
Summary of the regulation or change
Effective date and compliance deadline
Reference to official documentation
Department | Impact Description | Level | Owner |
Regulatory Affairs | Label templates need to be redesigned | High | Regulatory Manager |
Manufacturing | New packaging process needed | Medium | Ops Manager |
IT Systems | Update to labelling software | Medium | IT Business Analyst |
Legal | Review of compliance exposure | Low | Legal Counsel |
Training | Staff retraining required for new packaging process | Medium | HR/Training Lead |
Current state vs. required state
Specific non-compliance risks
Resource or skill gaps
Summary of tasks required to meet the regulation
Timeline aligned with regulatory deadline
Dependencies or risks
Who needs to be informed, consulted, or accountable
RACI matrix optional
Identify compliance, operational or reputational risks
Risk rating and mitigation strategy
Overall recommendation (e.g., proceed with update plan)
Names/signatures of approvers (Regulatory, Legal, PMO)
Engage Regulatory Affairs to obtain and interpret the new rule
Conduct stakeholder workshops/interviews with affected departments
Map current vs. future state using process flows or gap analysis
Document findings in the RAIA template
Review with legal and compliance for accuracy
Present recommendations to leadership or PMO
Ensure actions are tracked (possibly in project planning tools)
Ensure regulatory compliance
Prevent penalties or reputational damage
Align cross-functional teams
Inform project planning or business case development
Innovation – Collaboration
In business analytics, OPQ typically refers to an Organisational Process Qualification, Operational Process Qualification, or sometimes Organisational Performance Qualification, depending on the industry. However, OPQ is not a standard business analyst document like BRD, FRD, or SWOT.
That said, in some UK-based enterprise and operational change contexts, OPQ may refer to a high-level document that assesses the operational readiness or performance of a process/system before implementation. It’s often used in regulatory, operational risk, or process validation settings, particularly in regulated industries such as pharmaceuticals, manufacturing, or finance.
You’re a Business Analyst working with a large UK retail chain implementing a new Inventory Management System (IMS) across all warehouses.
Before the system goes live, the Operations Director requests an OPQ document to validate whether the processes, staff, and systems are ready.
OPQ (Operational Process Qualification) is a document that:
Assesses whether the new or changed operational process is fit-for-purpose.
Validates if it meets defined business and quality standards.
Checks if all requirements, training, tools, and people are aligned for a safe and successful go-live.
Here’s a real-world outline of what a Business Analyst might include:
Purpose of the OPQ
Background of the process/system being assessed
Project reference or link to BRD
Description of the business process under review
“As-is” vs. “To-be” comparison
Key workflows or diagrams (optional)
Category | Criteria | Status | Evidence |
People | Staff trained and available | ✅ Ready | Training logs |
Process | SOPs updated and published | ✅ Ready | SOP links |
Technology | System configured and tested | 🔶 In progress | UAT results |
Data | Master data cleansed and migrated | ✅ Complete | Data audit logs |
Compliance | GDPR / HSE / other standards reviewed | ✅ Compliant | Compliance checklist |
Risk Mitigation | Known risks logged and managed | ✅ Mitigated | Risk log reference |
Summary of any dry runs, simulations, or trial phases
Outcome of process validation or test scenarios
List of any remaining issues or constraints
Action plan or owner assignment
Summary opinion on readiness
Any pre-conditions for approval
Approval section (signed by BA, Ops Manager, QA if applicable)
Gather inputs from testing reports, training records, process owners, and stakeholder interviews.
Structure the report using a standard OPQ template.
Use real, audit-ready evidence to support your assessment.
Validate risks and readiness with stakeholders before submitting the OPQ.
Use a RAG (Red-Amber-Green) status to simplify reporting and highlight readiness visually.
Ensure the business process is ready for live operation.
Avoid compliance failures, downtime, or user confusion.
Validate that all teams (ops, IT, training, legal, compliance) are aligned.
Always align your OPQ with:
The Business Case (to ensure value is delivered),
The Requirements Documents (to ensure scope is met),
And the Test Plans (to verify performance is validated).
Innovation – Collaboration
You’re a Business Analyst working with a national retail chain planning to upgrade its CRM system to better manage customer engagement, loyalty programs, and sales.
Before selecting a solution, leadership wants a strategic analysis of internal and external factors that could impact success.
SWOT stands for:
Strengths (internal positives)
Weaknesses (internal negatives)
Opportunities (external positives)
Threats (external negatives)
It helps evaluate your organisation’s position before making a decision or implementing a change.
Gather information through stakeholder interviews, data analysis, and current-state assessments.
Categorise insights into the four SWOT quadrants.
Keep entries brief and specific.
Align findings with project goals (e.g., improved customer engagement, reduced churn).
SWOT | Details |
Strengths | – Strong brand recognition
– Loyal customer base
– Solid budget |
Weaknesses | – Legacy systems not integrated
– Poor data quality
– No mobile app |
Opportunities | – New CRM with AI capabilities
– Market shift to digital engagement |
Threats | – Competitors launching loyalty apps
– GDPR risks if data is mishandled |
PESTLE stands for:
Political
Economic
Social
Technological
Legal
Environmental
This analysis evaluates macro-environmental factors that could influence your project or organisation.
Research external trends (use news, government policy documents, industry reports).
Break down findings into each PESTLE category.
Focus on what’s relevant to your project or sector.
Relate risks or enablers to business strategy and stakeholder concerns.
PESTLE Factor | Details |
Political | – UK data privacy laws (post-Brexit)
– Government support for digital retail |
Economic | – Inflation increasing tech costs
– Budget cuts in retail sector |
Social | – Growing demand for personalised services
– Shift to online shopping |
Technological | – Rise of cloud-based CRM platforms
– AI/ML for customer insights |
Legal | – GDPR compliance requirements
– New regulations on data transfers |
Environmental | – CSR focus: systems should reduce paper use
– Preference for green data centers |
Microsoft Word or Excel (simple tables)
Miro or Lucidchart (for visual maps)
PowerPoint (for executive presentations)
Confluence or Notion (for collaboration)
During project initiation or discovery phase
When conducting a feasibility study
To support a Business Case
During a strategic review or risk assessment
SWOT is internal+external but subjective.PESTLE is strictly external and analytical.Using both gives a full picture to inform decisions.
Innovation – Collaboration
In business analytics, a Risk and Issue Log is a critical document that helps identify, track, and manage potential problems and active issues that could impact the success of a project. From a Business Analyst (BA) perspective, the log ensures transparency, supports mitigation planning, and helps stakeholders make informed decisions.
Term | Definition |
Risk | A potential event or condition that may occur and negatively impact the project (uncertain). |
Issue | A problem that has already occurred and needs immediate attention or resolution. |
You’re a Business Analyst on a project to upgrade the company’s CRM. During stakeholder interviews and vendor evaluation, you uncover several potential risks and one active issue that may delay requirements gathering.
Field | Description |
ID | Unique identifier (e.g., R001, I001) |
Type | Risk or Issue |
Description | Clear and concise summary of the risk or issue |
Impact | What area of the project it affects |
Likelihood (Risk Only) | Low / Medium / High |
Impact Level | Low / Medium / High |
Owner | Person responsible for managing or resolving |
Mitigation/Resolution Plan | Action plan to prevent or address |
Status | Open / In Progress / Resolved / Closed |
Date Identified | When the risk/issue was first recorded |
Target Resolution Date | Planned resolution timeline |
ID | Type | Description | Likelihood | Impact Level | Owner | Mitigation Plan | Status | Date Identified | Target Resolution |
R001 | Risk | Sales team may not adopt new CRM if UI is too complex | Medium | High | BA | Involve Sales team in UAT and select user-friendly vendor | Open | 2025-05-20 | 2025-06-15 |
ID | Type | Description | Impact Level | Owner | Resolution Plan | Status | Date Identified | Target Resolution |
I001 | Issue | Key Sales stakeholder unavailable for requirements workshops | High | PM | Reschedule workshops and escalate to sponsor | In Progress | 2025-05-18 | 2025-05-25 |
During interviews, workshops, or requirement reviews.
Ask: “What might go wrong?” or “What’s already impacting our progress?”
Use objective, neutral language.
Avoid blame—focus on the problem and solution.
Update status in weekly stand-ups or project check-ins.
Highlight escalated issues to the PM or sponsor early.
Share an updated log via email or project management tools like Jira, Trello, or Confluence.
Include in project updates or dashboards.
Use color-coding to visually highlight:
🔴 High-impact/high-likelihood risks
🟡 Medium-level concerns
🟢 Closed or mitigated items
Innovation – Collaboration
(Sometimes co-created with PM)
In business analytics, a Project Charter is a foundational document that formally initiates a project, outlines its goals, and gives the project manager (PM) and team the authority to begin work. Often co-created by the Business Analyst (BA) and the Project Manager, it aligns stakeholders and defines the scope, objectives, stakeholders, and resources early in the project lifecycle.
You’re a Business Analyst at a retail company. Leadership wants to implement a system that uses AI to analyze customer feedback across reviews, emails, and surveys. The project has been approved in principle, and now you, alongside the PM, need to write the Project Charter to formally kick it off.
A Project Charter is a high-level document that:
Authorizes the project
Outlines the purpose, scope, and stakeholders
Serves as a reference throughout the project
Helps prevent scope creep
Is often signed by a project sponsor
Clear and concise name of the project and what it’s about.
Example:
Title: AI-Driven Customer Feedback Analysis PlatformDescription: Implementation of an AI platform that consolidates and analyzes customer feedback across multiple channels to improve decision-making in product and service development.
Why is this project being done? What business problem does it solve?
Example:
The current customer feedback process is manual, time-consuming, and siloed. This project aims to automate sentiment analysis and generate actionable insights to improve customer satisfaction and retention.
SMART (Specific, Measurable, Achievable, Relevant, Time-bound) goals.
Example:
Integrate 3 primary data sources (email, reviews, surveys) within 3 months
Deploy dashboard with sentiment trends by Q3
Reduce feedback response time by 40% in 6 months
Clearly define what the project will and won’t do.
In Scope:
Sentiment analysis engine
Data connectors for email and survey platforms
Real-time dashboard
Out of Scope:
Manual customer follow-up
Feedback data from physical receipts
List of key people involved in or affected by the project.
Stakeholder | Role | Responsibilities |
Project Sponsor | Chief Marketing Officer | Funding and approvals |
Project Manager | Delivery oversight | Planning, budget, scheduling |
Business Analyst | Requirement gathering | BRD, stakeholder engagement |
Data Scientist | Model development | Sentiment scoring |
IT Team | Integration support | API/data pipeline setup |
Factors you assume to be true for the project to proceed.
Example:
Stakeholders are available for weekly check-ins
Existing feedback systems can export data via API
Time, cost, technology, or resource limitations.
Example:
Project budget capped at £80,000
Must be completed before Q4 product launch
Milestone | Target Date |
Project Kickoff | June 3, 2025 |
Data Source Integration Complete | July 15, 2025 |
AI Model Trained and Tested | August 30, 2025 |
Dashboard Deployment | September 15, 2025 |
Project Closeout | October 1, 2025 |
Risk | Impact | Mitigation Strategy |
Delayed API access | High | Engage IT early |
Data quality issues | Medium | Run early test extraction |
Name | Role | Signature | Date |
CMO | Sponsor | __________ | ______ |
PM | Project Manager | __________ | ______ |
BA | Business Analyst | __________ | ______ |
Project Charter – Customer Feedback Analysis Platform
Prevents scope creep
Aligns all parties on expectations
Helps secure formal approval
Acts as a reference point throughout the project
Innovation – Collaboration
In business analytics, once a system or product is delivered, Training and User Documentation ensures that end-users and stakeholders can effectively use the new solution. This documentation is critical for adoption, reducing support issues, and ensuring smooth operational transitions.
You’re a Business Analyst at a retail company that’s moving from spreadsheets to a new Customer Relationship Management (CRM) tool. You’ve gathered requirements, participated in development, and now the CRM is ready to launch.
To ensure that:
Staff understand how to use the new CRM system
Users can perform their day-to-day tasks confidently
The organization sees a return on investment from the tool
User Guide – Step-by-step instructions on using the system
Quick Reference Guide – A concise summary of key functions
Training Manual – Used during in-person or virtual training sessions
FAQs / Troubleshooting Guide
Role-based How-To Docs – Tailored for sales, customer service, etc.
Video Walkthroughs (optional but effective)
System Navigation Map – Overview of screens/modules
Sales reps, customer support, marketing managers
Vary technical depth based on roles
List out common tasks for each role, such as:
Adding a new customer
Logging a customer interaction
Generating a sales report
Avoid technical jargon
Use action verbs (Click, Select, Enter, etc.)
Annotated screenshots
Icons to indicate “Tips”, “Warnings”, etc.
Task: Add a New Customer Record
Step | Action | Screenshot (optional) |
1 | Click on the “Customers” tab | ✅ |
2 | Click “Add New Customer” | ✅ |
3 | Fill in required fields: Name, Email | ✅ |
4 | Click “Save” to create the record | ✅ |
5 | Confirmation message is displayed | ✅ |
markdown
CopyEdit
Title: Quick Start Guide – XYZ CRM Audience: Sales Representatives 1. Logging In 2. Viewing Today’s Tasks 3. Creating a Lead 4. Updating a Contact Record 5. Viewing Pipeline Dashboard 6. Logging a Customer Call 7. Generating Sales Reports
Tip: Include a 1-page printable PDF version of the Quick Guide.
markdown
CopyEdit
XYZ CRM Training Manual 1. Introduction to CRM 2. User Roles and Permissions 3. Navigation Overview 4. Key Functionalities – Leads Management – Contact Management – Reporting 5. Practice Exercises 6. Troubleshooting Common Issues 7. Support Contacts
PDF User Guide (CRM_UserGuide_XYZ.pdf)
Quick Reference Card (CRM_QRG_Sales.pdf)
PowerPoint Training Deck (CRM_Training_v1.pptx)
Optional: Training videos or LMS integration
Test with real users before finalizing documentation
Keep it role-specific and task-oriented
Update regularly when features change
Include feedback links or forms
Well-written training and user documentation:
Reduces helpdesk calls
Increases user confidence
Ensures consistent use of the system
Speeds up onboarding for new employees
Innovation – Collaboration
In business analytics, Test Plans and Test Cases are crucial for ensuring that the implemented solution meets the business and technical requirements. While Quality Assurance (QA) leads the testing process, Business Analysts (BAs) play a key role in defining what needs to be tested and ensuring it aligns with the business objectives.
You’re a Business Analyst working with a financial institution rolling out a new feature in their online banking app: instant money transfers to international accounts.
As the BA, you’re collaborating with QA to ensure the system works correctly before launch.
A Test Plan is a high-level document that outlines the testing scope, objectives, strategy, and schedule for verifying a product or feature.
Test objectives
Scope (in-scope and out-of-scope)
Testing types (unit, integration, UAT, etc.)
Resources & responsibilities
Test environment
Entry/Exit criteria
Risks and mitigation
vbnet
CopyEdit
Project: Online Banking App v3.2 Module: Instant International Transfers Prepared By: Sarah James, Business Analyst Reviewed By: QA Lead – Tom Lewis Date: 23-May-2025
Verify that users can send international transfers instantly
Confirm correct application of fees and currency conversion
Validate confirmation messages and error handling
In Scope:
Transfer from UK accounts to selected countries
UI behavior on mobile and desktop
Fee calculation logic
Out of Scope:
Transfers outside supported currencies
Back-end database load testing
Functional Testing
Integration Testing (with banking APIs)
User Acceptance Testing (UAT)
QA Tester: Emma Ford
BA Reviewer: Sarah James
Dev Support: Mark Patel
Staging environment with mock bank APIs
Latest version of mobile app installed
Code deployed in staging
Requirements sign-off complete
All critical test cases passed
No open high/critical bugs
A Test Case is a detailed step-by-step description used to verify a particular requirement or scenario.
Field | Description |
Test Case ID | TC_001 |
Title | Submit international transfer with valid inputs |
Preconditions | User is logged into the mobile app |
Test Steps | 1. Navigate to Transfers section
2. Select international account
3. Enter valid amount
4. Submit |
Expected Result | Confirmation screen shows “Transfer Submitted Successfully” within 5 seconds |
Actual Result | [To be filled by QA] |
Status | Pass / Fail |
Priority | High |
Requirement ID | REQ_015 – Instant Transfer UX |
TC_002 – Submit with insufficient funds → Expect error
TC_003 – Submit with invalid IBAN → Expect validation alert
TC_004 – Ensure correct exchange rate is applied
TC_005 – Check email notification is sent post-transfer
BA writes and reviews business requirements (BRD, FRD)
QA creates test plan based on BA’s input
BA reviews and validates test cases against requirements
BA participates in UAT and defect triaging
Both work together to ensure traceability from requirements to tests
Test Plan (TestPlan_OnlineBanking_v3.2.docx)
Test Case Sheet (TestCases_Transfers.xlsx)
May also include traceability matrix to ensure full coverage
Ensures delivered solution meets user and business needs
Avoids costly bugs and rework
Provides a record of tested functionality
Builds confidence for stakeholder sign-off
Innovation – Collaboration
The Solution Assessment Document helps:
Compare potential solutions
Assess an implemented solution’s effectiveness
Identify gaps, issues, or opportunities for improvement
Support decision-making about enhancements, rollout, or replacement
You’re a Business Analyst at an e-commerce company. A new Returns Management System (RMS) was implemented to streamline how customers return products.
After 3 months, stakeholders report mixed feedback. Your task is to assess the solution and provide recommendations.
yaml
CopyEdit
Document Title: Solution Assessment – Returns Management System Author: Priya Shah, Business Analyst Date: 23-May-2025 Version: 1.0 Project Name: E-commerce RMS Improvement
Brief overview of the assessment purpose and key findings.
This document evaluates the Returns Management System implemented in Q1 2025. While the solution meets basic return processing needs, it lacks automation and real-time tracking, leading to customer dissatisfaction and increased support calls.
Summarize original goals:
Reduce average return processing time from 5 days to 2
Minimize support tickets related to returns by 40%
Provide real-time return status updates to customers
Briefly describe the system or solution:
The RMS is a custom-built module integrated into the company’s order management system. It supports barcode scanning, manual status updates, and basic refund processing.
Compare current state against desired outcomes:
Criteria | Target | Actual Outcome | Notes |
Avg. return processing time | ≤ 2 days | 3.5 days | Manual steps causing delays |
Return-related support tickets | ↓ 40% | ↓ 15% | Poor visibility for customers |
Real-time status tracking | Implemented fully | Partially implemented | Status updated once daily |
Identify where and why the solution is underperforming.
Gap: No automated notifications → Customers call support
Gap: Staff manually update statuses → Slower turnaround
Gap: System not fully integrated with logistics → Tracking delays
Use methods like the 5 Whys or Fishbone Diagram to identify causes.
Example:Why are customers not receiving updates? → No auto-emailsWhy? → Notification engine not configuredWhy? → Deprioritized in initial scope
Recommendation | Priority | Estimated Cost | Expected Benefit |
Implement automated email updates | High | £3,000 | Reduce support calls by 30% |
Full logistics system integration | Medium | £7,000 | Improve tracking accuracy and speed |
Provide self-service return portal | Low | £5,000 | Enhance customer experience |
Summarize whether the solution is:
Fit for purpose
Requires enhancements
Needs partial or full replacement
The current RMS meets core requirements but does not fully satisfy business goals. Enhancements are needed to improve automation and customer transparency.
Survey results
Interview transcripts
Metrics dashboard screenshots
Risk assessment matrix
Use quantitative data (KPIs, metrics)
Involve stakeholders across departments
Present clear, actionable recommendations
Include cost/benefit insights
Keep the document objective and structured
File Name: SolutionAssessment_RMS_May2025.docxLength: 5–10 pages depending on complexityAudience: Business stakeholders, IT, project sponsors
A Solution Assessment helps the business:
Make data-driven decisions
Improve or retire underperforming solutions
Align solutions with changing business needs
Innovation – Collaboration
A Change Request Document formally captures a proposed change, the rationale behind it, the potential impact, and the decision regarding its approval or rejection. It’s used throughout the project lifecycle to manage and control changes.
You’re a Business Analyst working on implementing a new Customer Relationship Management (CRM) system. Midway through the project, the sales team realizes they need an additional feature: automated lead scoring based on engagement levels.
This feature wasn’t part of the original scope, so a Change Request must be documented and evaluated.
Here’s a standard structure for a CR document with a worked example:
yaml
CopyEdit
Change Request ID: CR-007 Project Name: CRM Implementation – Sales Module Date Submitted: 23-May-2025 Requested By: Mark Benson, Sales Manager Prepared By: Sarah Khan, Business Analyst Version: 1.0
Requested Change: Add an automated lead scoring feature to prioritize leads based on their interaction history (emails opened, website visits, form submissions).
The current CRM configuration does not prioritize leads. Sales reps spend time on cold leads instead of focusing on high-value prospects. Automating this will enhance conversion rates.
Area | Impact Description |
Scope | Will expand to include lead scoring logic and UI updates |
Schedule | Estimated delay of 2 weeks |
Budget | £8,000 additional development cost |
Risk | Minimal; scoring algorithm is straightforward to implement |
Quality | May improve lead quality insights for the sales team |
Dependencies | Integration with marketing data sources (e.g., HubSpot API) |
Implement now (impact: cost & delay)
Defer to Phase 2
Reject change (risk: lost efficiency for sales)
Recommend implementing now due to its projected value in sales performance, despite the slight delay.
Role | Name | Signature | Date |
Project Sponsor | Jane Reynolds | [Signed] | 24-May-2025 |
Project Manager | Tom Hughes | [Signed] | 24-May-2025 |
Business Analyst | Sarah Khan | [Signed] | 24-May-2025 |
Use a standard CR template for consistency
Always assess change impact in terms of scope, time, cost, risk, and quality
Involve relevant stakeholders in the approval process
Document both approved and rejected changes for transparency
Include version control for tracking
Help manage scope creep with control
Ensure business and IT stay aligned
Prevent untracked changes that could derail timelines or budgets
Provide an audit trail of decision-making
File Name: CR_007_Add_LeadScoring_CRM.docxPages: 2–3 typically
Innovation – Collaboration
An SRS is a comprehensive document that describes the functional and non-functional requirements of a system. It acts as a bridge between business needs and technical implementation.
What the system should do (Functional Requirements)
How the system should behave (Non-functional Requirements)
System interfaces
Constraints
Assumptions and dependencies
Company: Mid-sized software companyProblem: Support requests are currently handled via email, resulting in delays and no tracking.Goal: Build a web-based Customer Support Ticketing SystemBA Task: Create the SRS to guide the dev team
yaml
CopyEdit
Title: System Requirements Specification – Support Ticketing System Author: Alex Thomas, Business Analyst Date: May 2025 Version: 1.0
Purpose: Define the features, constraints, and functionality of the support ticketing system.
Intended Audience: Business stakeholders, developers, testers, project managers.
“The system allows customers to raise, track, and resolve support tickets. Admins can assign tickets to agents and monitor performance.”
Req ID | Description |
FR-1 | Users can register and log in securely |
FR-2 | Customers can raise a ticket by selecting a category and describing the issue |
FR-3 | Admins can assign tickets to support agents |
FR-4 | Users can view ticket history and statuses |
FR-5 | Email notifications are sent when ticket status changes |
Req ID | Description |
NFR-1 | The system must support 1000 concurrent users |
NFR-2 | Page load time must not exceed 3 seconds |
NFR-3 | The system must be accessible 24/7 with 99.9% uptime |
NFR-4 | All data must be encrypted in transit and at rest |
Interface Type | Description |
UI | Web interface for customers and support agents |
API | RESTful API to integrate with CRM |
SMTP service to send ticket updates |
Entity | Field | Type | Notes |
Ticket | ticket_id | String | Unique identifier |
| status | Enum | Open, In Progress, Closed |
User | user_id | Integer | Registered user ID |
Only internal users with valid credentials can assign tickets.
The system must be responsive for mobile users.
Wireframes
Glossary
External system references
Keep language clear and unambiguous
Use “shall” or “must” for mandatory features
Use diagrams (like use case or flowcharts) to illustrate processes
Review with both business and tech stakeholders for completeness
Document Name: SRS_SupportTicketingSystem_v1.0.docxLength: Typically 10–20 pages, depending on complexity
Ensures alignment between business goals and IT solutions
Prevents scope creep
Forms the basis for design, development, and testing
Reduces misunderstandings and rework
Innovation – Collaboration
An IRD describes how two systems, applications, or modules interact and exchange data. It outlines:
Data flows
Data formats
Communication protocols
Frequency and direction of data exchange
Error handling and security
Company: A UK-based retail chainProject: The in-store Point of Sale (POS) system must sync real-time inventory with the central ERP system.Goal: As a Business Analyst, you need to define the interface requirements between POS and ERP.
vbnet
CopyEdit
Title: Interface Requirements Document – POS to ERP Sync Author: Jane Smith, Business Analyst Date: May 2025 Version: 1.2
This document defines the data interface requirements for real-time inventory synchronization from in-store POS systems to the central ERP system. The interface ensures inventory counts are updated after each sale.
Component | Description |
POS | Front-end system where sales occur |
ERP | Backend system managing inventory, orders, and finance |
Field | Description |
Interface Name | POS-ERP_Inventory_Update |
Source System | POS |
Destination System | ERP |
Data Direction | One-way (POS → ERP) |
Trigger | On each sale transaction |
Frequency | Real-time |
Protocol | REST API over HTTPS |
Authentication | OAuth 2.0 |
Field Name (POS) | Field Name (ERP) | Data Type | Format | Required | Notes |
product_id | item_code | String | Alphanumeric | Yes | Unique identifier |
quantity_sold | quantity | Integer | Numeric | Yes | Deducted from current stock |
transaction_time | txn_timestamp | DateTime | ISO 8601 | Yes | UTC timestamp |
store_location_id | store_id | String | Alphanumeric | Yes | Maps to ERP store table |
Error Scenario | Handling Rule |
Invalid product ID | Log error, skip record, alert POS team |
ERP API timeout | Retry 3 times, escalate if still fails |
Quantity field empty | Reject record, send error response |
All data transfers use HTTPS
OAuth 2.0 for API token-based authentication
No PII is transferred
Data retained in ERP for 6 months for audit
POS must be online for real-time updates
ERP API limit: 100 requests/sec
Data latency tolerance: < 5 seconds
Define clear data exchange rules between systems
Avoid data loss or duplication
Prevent integration delays or costly rework
Ensure traceability for data lineage and auditability
File Name: IRD_POS_to_ERP_InventorySync.docx
Length: Usually 5–10 pages for medium complexity
Always include sample data payloads (e.g., JSON/XML)
Collaborate with devs, system architects, and QA
Use diagrams to visualize the data flow (optional but helpful)
Version-control the IRD document
Innovation – Collaboration
An RTM is a document that links business requirements to their corresponding functional requirements, test cases, and project deliverables. It ensures:
All requirements are accounted for
Nothing is missed during development or testing
You can track changes and validate coverage
Company: Fintech startup in the UKProject: Launching a customer-facing mobile banking appBusiness Analyst Role: Ensure every business requirement (e.g., “users can view account balance”) is implemented, tested, and traceable.
Start with a simple table format using Excel, Google Sheets, or project tools like Jira, Confluence, or Azure DevOps.
Sample Column Headers:
Req ID | Requirement Description | Functional Requirement | Design Reference | Test Case ID | Status | Comments |
Use the Business Requirements Document (BRD) as your starting point.
Req ID | Requirement Description |
BR-001 | Users must be able to log in securely |
BR-002 | Users must view account balances |
Trace each business requirement to one or more functional specs from the Functional Requirements Document (FRD).
| BR-001 | Login with 2FA support || BR-002 | Display balance on dashboard |
Link to design documents or system specs (e.g., Figma links, ERDs, technical design specs).
| BR-002 | /dashboard.html or API: /user/balance |
Map each requirement to one or more test cases from your QA/testing team.
| BR-001 | TC-001: Login with correct credentials| BR-002 | TC-005: Verify balance is accurate after login |
Update the status (e.g., Draft, In Progress, Tested, Complete) as the project progresses.
Req ID | Requirement Description | Functional Requirement | Design Reference | Test Case ID | Status | Comments |
BR-001 | Secure login for users | Login with password + OTP | LoginScreen_v3 | TC-001 | Tested | Working as expected |
BR-002 | View account balance | Display balance from database | AccountDashboard_v2 | TC-005 | In Progress | Awaiting backend build |
Keep the table up to date—it’s a live document
Include IDs and consistent naming for easy referencing
Collaborate with QA and developers to verify links
Use color coding or status filters for quick visibility
Automate where possible using tools like Jira or TestRail
They ensure requirements are fulfilled and validated
Provide audit trails for compliance or QA teams
Highlight gaps or missed test coverage
Make your BA work transparent and traceable to stakeholders
Innovation – Collaboration
A Gap Analysis identifies the difference between:
The current state of a process, system, or performance
The desired future state
And what’s missing in between (the “gap”)
It helps organizations understand what needs to change to meet their goals.
Identify inefficiencies, risks, or unmet business needs
Define improvement opportunities
Prioritize actions or requirements for projects
Justify business or system change initiatives
Company: Mid-size online retailer in the UKProblem: Frequent delays in dispatching ordersGoal: Reduce order dispatch time from 48 hours to 12 hoursBA Task: Conduct a gap analysis of the Order Fulfilment process
Title: Gap Analysis – Order Fulfilment
Author: Jane Doe, Business Analyst
Date: May 2025
Project Name: Dispatch Efficiency Improvement
Version: 1.0
A summary of the purpose, scope, and findings.Example:”This document analyzes the current order fulfilment process and identifies gaps between current and desired dispatch timelines. It outlines key bottlenecks and provides recommendations for process improvement.”
Define what part of the business/process is being analyzed.Example:“This analysis covers the dispatch process from order confirmation to warehouse handoff for UK standard orders only.”
Describe the existing process, tools, systems, and performance metrics.
Example:
Orders confirmed in system → Manually entered into warehouse queue
Limited automation, high reliance on warehouse staff
Avg dispatch time: 48 hours
System: Legacy warehouse management tool with no real-time tracking
Describe the desired performance, process, or technology goals.
Example:
Automated order queue integration with warehouse system
Real-time order tracking
SLA: 90% of orders dispatched within 12 hours
System upgrade to SAP Fulfilment Cloud
Area | Current State | Desired State | Gap Description | Impact |
Order entry | Manual entry | Automated system integration | Time-consuming and error-prone | High risk of delay |
Tracking | No real-time status | Real-time updates for customers | Poor customer visibility | Increase in complaints |
Dispatch timeline | 48 hours average | 12 hours SLA | Inefficient handling | Affects customer loyalty |
Provide actionable suggestions to close the gaps.
Example:
Implement API integration between order system and warehouse system
Upgrade to real-time dashboard for tracking
Re-train warehouse staff on new process flow
Summarize key gaps and urgency for resolution.
Example:
“Addressing these gaps is critical to meeting customer expectations and remaining competitive. Immediate action is recommended for automation and training.”
Use clear headings and tables
Stick to facts and quantifiable data
Prioritize gaps based on business impact
Use visuals like process flows or comparison charts if helpful
Collaborate with stakeholders to validate findings
Innovation – Collaboration
A Process Flow Diagram or Workflow Diagram is a visual representation of a business process. It shows the steps (activities), decision points, inputs/outputs, and involved stakeholders (actors) in a workflow.
In business analytics, these diagrams help you understand and communicate how things currently work (AS-IS) and how they should work (TO-BE).
Company: UK Online RetailerProblem: High return rates and customer complaints about delays in refundsProject: Streamline and improve the Returns and Refunds ProcessGoal: Map out the current process to identify delays and bottlenecks
Lucidchart (cloud-based)
Microsoft Visio (enterprise-grade)
Draw.io (diagrams.net) (free and easy)
Miro or Figma (collaborative whiteboard-style tools)
Process: Customer Returns a ProductScope: From the customer request to refund completionActors: Customer, Customer Service Agent, Warehouse Staff, Payment Team
Use workshops, interviews, or observation to capture steps. Example:
Customer requests return online
System generates return label
Customer ships item back
Warehouse receives and inspects item
System notifies customer service
Refund request sent to payments team
Refund processed and confirmation sent
Here’s a simplified textual version of the flow:
rust
CopyEdit
[Customer] –> (Submit Return Request) –> [System] –> (Generate Return Label) | [Customer] <– (Returns Item) –| –> [Warehouse] –> (Inspect Item) | –> [Customer Service] –> (Approve Refund) | –> [Payments Team] –> (Process Refund) | [Customer] <– (Receive Refund Confirmation)
Legend:
[Square brackets] = Actor
(Parentheses) = Process step
Arrows = Flow direction
In diagram tools, use:
Ovals for start/end
Rectangles for process steps
Diamonds for decision points
Arrows for sequence
Present it to business users, IT, and management to validate the current process and uncover any gaps or inconsistencies.
After identifying inefficiencies (e.g., manual refund approvals), create a proposed TO-BE process with improvements (e.g., automate refund initiation if return is auto-approved).
Make complex processes easy to understand
Reveal redundancies, bottlenecks, and manual steps
Improve requirement gathering and alignment
Help in business case creation or automation planning
Keep it simple and logical (top-to-bottom or left-to-right)
Include actors/roles
Use consistent symbols
Document exceptions/decisions if they affect flow
Include a legend or key if needed
Innovation – Collaboration
In business analytics and systems analysis, a Use Case Specification is a detailed description of a user interaction (use case) with a system to achieve a goal.
It outlines:
Actors (users or systems)
Steps (interactions with the system)
Preconditions
Postconditions
Exceptions
Think of it as a script that explains who does what and what the system does in return.
Company: UK-based logistics firmProject: Develop a parcel tracking dashboard for customer service agentsUse Case Title: “Track Parcel by Order Number”
Element | Description |
Use Case ID | UC-101 |
Use Case Name | Track Parcel by Order Number |
Actor(s) | Customer Service Agent |
System | Parcel Tracking Dashboard |
Description | Agent enters order number to retrieve current parcel status and history |
Trigger | Customer calls to ask about parcel status |
Priority | High |
Agent is logged into the system Order number has already been generated and recorded in the system
Step | Actor/System | Action |
1 | Customer Service Agent | Opens the Parcel Tracking Dashboard |
2 | Agent | Inputs the customer’s order number |
3 | System | Validates the order number format |
4 | System | Retrieves parcel status and delivery history |
5 | System | Displays the information to the agent in the dashboard |
6 | Agent | Communicates the parcel status to the customer |
Step | Actor/System | Action |
3a | System | Displays “Order number not found” error message |
4a | Agent | Asks customer to re-confirm the number or escalate |
Step | Actor/System | Action |
4b | System | Displays “System error: try again later” |
5b | Agent | Apologises to the customer and raises IT support ticket |
Parcel tracking data has been viewed by the agent Customer has been informed of the parcel status
Only valid order numbers (alphanumeric, 10 characters) may be submitted Agents cannot access orders from other regions due to data protection policy
System is live and has access to real-time delivery data Agents are trained on using the dashboard
Agents can resolve parcel status inquiries within 2 minutes 95% of valid order lookups return data within 5 seconds
They help:
Clarify functional needs
Guide developers and testers
Define user/system boundaries
Uncover missing or inconsistent requirements
Innovation – Collaboration
In business analytics, an NFR document describes how a system should perform, rather than what it should do (which is covered in functional requirements). It ensures that the system’s quality attributes—like speed, scalability, security, and usability—meet stakeholder expectations.
Think of it this way:Functional Requirement = What it should doNon-Functional Requirement = How well it should do it
Company: National eCommerce BrandProject: Develop a Product Analytics DashboardGoal: Help product managers track performance, customer ratings, and returnsYou are the Business Analyst documenting the NFRs before development begins.
Title: Non-Functional Requirements – Product Analytics DashboardAuthor: Maya ClarkVersion: 1.0Date: 23 May 2025
Brief context:
This document defines non-functional requirements related to performance, availability, security, usability, and scalability for the Product Analytics Dashboard.
Organize NFRs by category. Here’s how it might look:
ID | Requirement |
NFR-001 | Dashboard pages must load in under 4 seconds under normal load |
NFR-002 | Reports must generate within 10 seconds with up to 100,000 records |
NFR-003 | Real-time filters must apply changes in under 3 seconds |
ID | Requirement |
NFR-004 | System must be available 99.9% of the time during business hours |
NFR-005 | Daily data refreshes must be completed by 7:00 AM GMT |
NFR-006 | Recovery time after failure must be less than 30 minutes |
ID | Requirement |
NFR-007 | User access must be authenticated via SSO (Azure AD) |
NFR-008 | Role-based access controls must restrict data by department |
NFR-009 | All data must be encrypted in transit (TLS 1.2 or higher) |
ID | Requirement |
NFR-010 | The system must handle a 100% increase in user load without performance degradation |
NFR-011 | Data pipelines must be able to ingest 1 million records per day without downtime |
ID | Requirement |
NFR-012 | The dashboard interface must adhere to the company’s UI standards |
NFR-013 | Users should be able to learn core functionality within 10 minutes |
NFR-014 | Tooltips and onboarding instructions must be included for all new features |
ID | Requirement |
NFR-015 | All components must be logged using the standard company logging tool |
NFR-016 | Dashboards must be version-controlled in Git |
NFR-017 | Weekly error reports must be emailed to the BI team automatically |
Clarify what this document depends on and assumed conditions:
The system will be hosted on Azure Cloud The Data Engineering team will manage ETL job performance No additional load balancers will be added during the first release
List how you’ll validate each NFR:
Requirement ID | Test Method |
NFR-001 | Load test using JMeter to simulate user load |
NFR-007 | Validate SSO login with test users |
NFR-012 | Usability testing with 5 users from different teams |
Name | Role | Signature | Date |
Emily Wong | Head of Product |
|
|
Raj Mehta | BI Architect |
|
|
Without clearly defined NFRs, you risk:
Dashboards loading too slowly to be useful
Unsecure access to sensitive data
Unscalable systems that fail as usage grows
Poor user adoption due to bad design
Be specific and measurable (“load in <4s”, not just “fast”)
Use numbered IDs for easy reference in testing and tracking
Collaborate with IT/security/engineering early on
Include test methods or KPIs where possible
Innovation – Collaboration
A Functional Requirements Document (FRD) outlines in technical detail how a system should behave to meet the business needs defined in the Business Requirements Document (BRD).
It translates business needs into functional specs—what the system should do, how it should react to inputs, and how it integrates with other systems.
Feature | BRD | FRD |
Focus | What the business needs | How the system will fulfill those needs |
Written by | Business Analyst | Business Analyst + Technical Lead |
Audience | Business stakeholders | Technical team |
Example | “The dashboard must show sales by region” | “The dashboard will pull data from Snowflake every hour using API XYZ” |
Company: Online fashion retailerProblem: Executives lack insight into inventory levels across warehousesProject: Build a real-time inventory dashboardYou are the Business Analyst creating the FRD based on an already-approved BRD.
Title: Functional Requirements Document – Inventory DashboardVersion: 1.0Author: Alex JohnsonDate: 23 May 2025
Summarize the business problem and project purpose.
The goal is to provide a real-time dashboard that shows stock levels by SKU and warehouse location to help with restocking decisions and order fulfillment efficiency.
Describe the system components in simple terms.
This dashboard will be developed in Power BI, pulling data from the company’s central PostgreSQL database via an ETL pipeline scheduled every 30 minutes.
These are detailed system behaviors and features that fulfill the business requirements.
ID | Functional Requirement |
FRD-001 | The system must display inventory levels by SKU, location, and status (available, reserved, damaged) |
FRD-002 | Users must be able to filter inventory data by product category and warehouse |
FRD-003 | Data must refresh every 30 minutes from the PostgreSQL database |
FRD-004 | Access should be restricted using Azure AD roles |
FRD-005 | Export to Excel and PDF options must be available |
FRD-006 | The system must trigger an alert when stock falls below reorder level |
Define the data inputs, including sources, formats, and calculations.
Data Element | Source | Frequency | Notes |
SKU | Inventory DB | Real-time | Unique identifier |
Stock Quantity | Inventory DB | Every 30 mins | Aggregated by location |
Reorder Level | Inventory DB | Static | Used for alert logic |
Detail access levels and actions per user role.
Role | View Data | Export | Admin Settings |
Warehouse Manager | ✅ | ✅ | ❌ |
Inventory Admin | ✅ | ✅ | ✅ |
Screens or features users interact with.
Screen | Description |
Dashboard View | Main UI with real-time tables and charts |
Filter Panel | Filter by category, SKU, warehouse |
Alert Settings | Configure low-stock alert thresholds |
Specify performance, security, and system behavior expectations.
The dashboard must load within 3 seconds
Data refresh must complete within 2 minutes
System must be available 99.5% of the time
User authentication must comply with company SSO standards
Mention tools, integrations, or other projects this depends on.
ETL pipeline development by the Data Engineering team
Access to PostgreSQL via service account
Power BI Pro licenses for all users
Data quality is validated at the source
All required SKUs are tagged correctly in the database
Mobile responsiveness is not a priority
Include a space for key stakeholders to sign off.
Name | Role | Signature | Date |
Lisa Chen | Project Manager |
|
|
Jay Patel | Tech Lead |
|
|
Sarah Lee | Warehouse Ops Head |
|
|
Your FRD is now a blueprint that:
Guides developers and data engineers
Keeps QA aligned for testing
Ensures traceability from BRD to solution
Use clear, numbered requirements
Avoid jargon—write so both tech and business can understand
Work closely with tech leads or solution architects
Include visuals like mockups, diagrams, or process flows (if helpful)
Innovation – Collaboration
A Stakeholder Analysis is a tool that helps a business analyst identify:
Who is affected by or interested in a project,
What their needs and expectations are,
How much influence and interest they have,
And how best to engage or manage them.
It’s essential for ensuring that the project meets the right goals and gains support from key people.
Company: National logistics firmProject: Develop a predictive analytics dashboard to forecast delivery delays using machine learning.Purpose: Reduce late deliveries and improve customer satisfaction.
Start by brainstorming anyone who is involved in, affected by, or has influence over the project.
Name | Role | Department |
Sarah Lee | Head of Operations | Operations |
Tom Rivera | Senior Data Scientist | Data Team |
Rachel Marks | Customer Service Manager | Support |
Ian Patel | CTO | Executive |
Delivery Drivers | End Users | Field Team |
Rate each stakeholder’s Interest (how much they care) and Influence (how much power they have to affect the project).
Stakeholder | Interest (Low/Med/High) | Influence (Low/Med/High) |
Sarah Lee | High | High |
Tom Rivera | Medium | Medium |
Rachel Marks | High | Low |
Ian Patel | Medium | High |
Delivery Drivers | High | Low |
This visual tool helps you decide your engagement strategy.
lua
CopyEdit
POWER / INFLUENCE High | Low ———————-+—————— High | Manage Closely | Keep Informed Interest| (e.g., Sarah Lee) | (e.g., Rachel) ———————-+—————— Low | Keep Satisfied | Monitor | (e.g., Ian Patel) | (e.g., Others)
For each key stakeholder, note how and when you will engage with them.
Stakeholder | Strategy | Engagement Activities |
Sarah Lee (Ops Head) | Manage Closely | Weekly meetings, review dashboards |
Tom Rivera (Data) | Collaborate | Coordinate on data modeling, APIs |
Rachel Marks (Support) | Keep Informed | Email updates, user feedback sessions |
Ian Patel (CTO) | Keep Satisfied | Monthly updates, ensure alignment with tech goals |
Delivery Drivers | Consult | User testing, surveys post-pilot |
Include this in your project plan or presentation deck so the team is aware of:
Who they need input from
Who needs buy-in
Who can help or block progress
Name | Role | Interest | Influence | Engagement Strategy |
Sarah Lee | Ops Head | High | High | Weekly meetings, review data |
Tom Rivera | Data Scientist | Med | Med | Technical sync-ups |
Rachel Marks | CS Manager | High | Low | Email updates |
Ian Patel | CTO | Med | High | Executive briefings |
Delivery Drivers | End Users | High | Low | Field surveys, pilot feedback |
Keep your analysis updated as project dynamics change.
Stakeholder resistance often comes from lack of information—your analysis helps prevent that.
Use this analysis to inform your communication plan.
Innovation – Collaboration
A BRD is a formal document that outlines:
What the business needs from a system or project
Why these needs exist
What success looks like
It’s written primarily from the business user’s perspective
Think of it as the bridge between business stakeholders and technical teams, ensuring everyone is aligned before development begins.
Company: National RetailerProblem: Executives have no central visibility of weekly regional sales trendsProject: Develop an interactive sales dashboardBusiness Analyst’s Task: Write a BRD to define what this dashboard must deliver
Include the project name, version, author, date, and reviewers.
Document Name: Business Requirements Document – Executive Sales DashboardAuthor: Jamie SmithDate: 23 May 2025Version: 1.0Reviewed By: Sales Director, BI Manager
Brief summary of the project and the business context.
The Sales team lacks real-time visibility into performance across regions. This dashboard project aims to provide KPIs such as revenue, profit margin, and unit sales by region, category, and time frame.
What the business wants to achieve.
Provide weekly sales performance visibility to leadership
Enable region-to-region comparison
Identify underperforming products quickly
Reduce reliance on static Excel reports
Define what’s in scope and out of scope.
✅ In Scope:
Dashboard to show KPIs by region and product category
Filter by week, store, and product line
Integration with Snowflake data warehouse
🚫 Out of Scope:
Predictive analytics or ML models
Mobile app integration
Clearly numbered statements of what the system must do. These are business-focused, not technical.
ID | Requirement |
BRD-001 | The dashboard must allow filtering by week and region |
BRD-002 | It must show KPIs: revenue, units sold, profit margin |
BRD-003 | Users must be able to export data to Excel |
BRD-004 | Access should be restricted by user role (e.g., regional manager) |
List who is involved or impacted.
Name | Role | Responsibility |
John Doe | Sales Director | Sponsor, requirements sign-off |
Priya Kaur | BI Manager | Oversees dashboard development |
Analysts | End Users | Will use the dashboard weekly |
Clarify any conditions.
Assumptions:
Data is already cleansed in Snowflake
Power BI licenses are available
Constraints:
Project deadline is 4 weeks
No new data sources will be added
Define how the business will confirm the solution meets their needs.
The dashboard loads in under 5 seconds
Users can filter by date, product, and region
Accuracy of displayed data matches back-end queries
Term | Definition |
KPI | Key Performance Indicator |
Region | A sales geography, e.g., North, Midlands |
You should now have a document that:
Can be signed off by stakeholders
Guides the data/BI team
Ensures everyone is aligned on what’s being built
Keep language clear and non-technical
Validate requirements with real users
Use numbered requirements for easy reference in testing
Avoid solution details (leave those to the technical spec)